Custom Power BI Dashboards That Show What Is Driving Your Revenue, Costs, Customers, and Operations. All in One Clear View.
Your business generates data every second. I connect your spreadsheets, systems, and reports into a live dashboard your team can use every week. You get smarter decisions, clearer opportunities, and the confidence to grow.
Why Custom Business Intelligence?
Most software comes with standard reports but every business is different. I build customized Business Intelligence solutions that answer the questions generic dashboards can't. Instead of simply showing numbers, your dashboards reveal:
Tools & Platforms I Work With
Every project goes beyond charts. I build the model, the metrics, and the visuals your team actually needs to make better calls.
Custom Power BI dashboards built around your actual business metrics. Operations, finance, sales. Whatever runs your business.
Know what's coming before it arrives. I build forecasting models based on your own historical data, not industry averages.
Track staffing, capacity, and scheduling in real time. Catch problems before they show up on the P&L.
Test decisions before you commit to them. Staffing changes, pricing shifts, market moves. Run the scenario first.
Standard charts only go so far. I build branded, easy-to-read visuals your team will actually understand at a glance.
I connect your data sources (databases, spreadsheets, APIs, CRMs) and build a clean model underneath so everything runs fast and accurate.
Instead of going with your gut, you'll be making calls backed by actual data. Here's what that looks like in practice:
I don't just build dashboards. I build systems that help you run your business better, starting from the first time you open it.
Data by itself doesn't change anything. Knowing what to do with it does.
Each project below was built on real business scenarios. Screenshots, business problem, and results are shown for each.
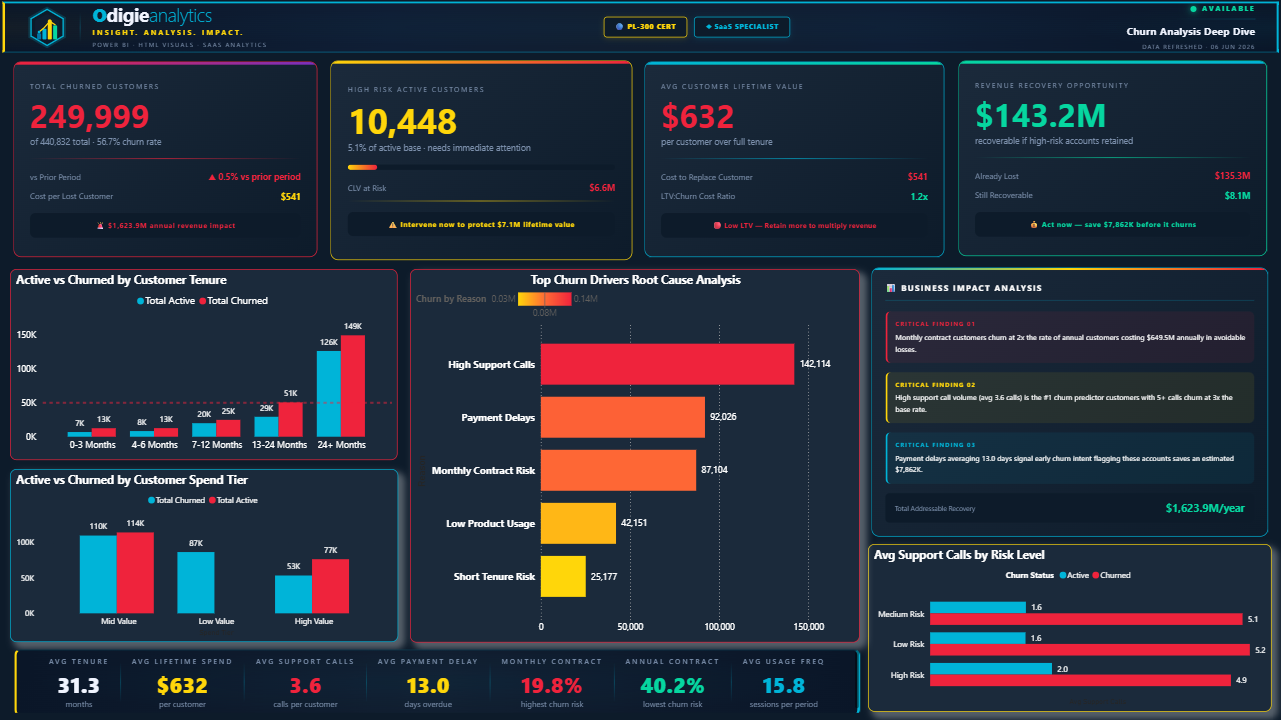
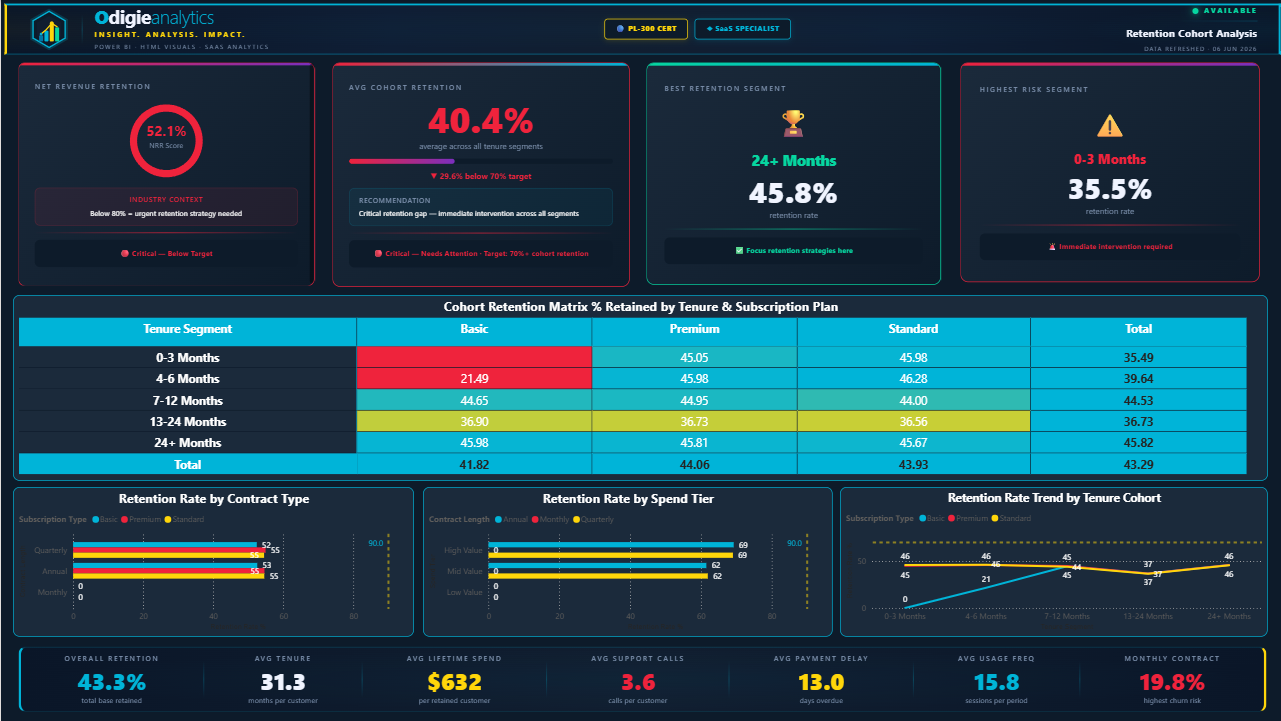
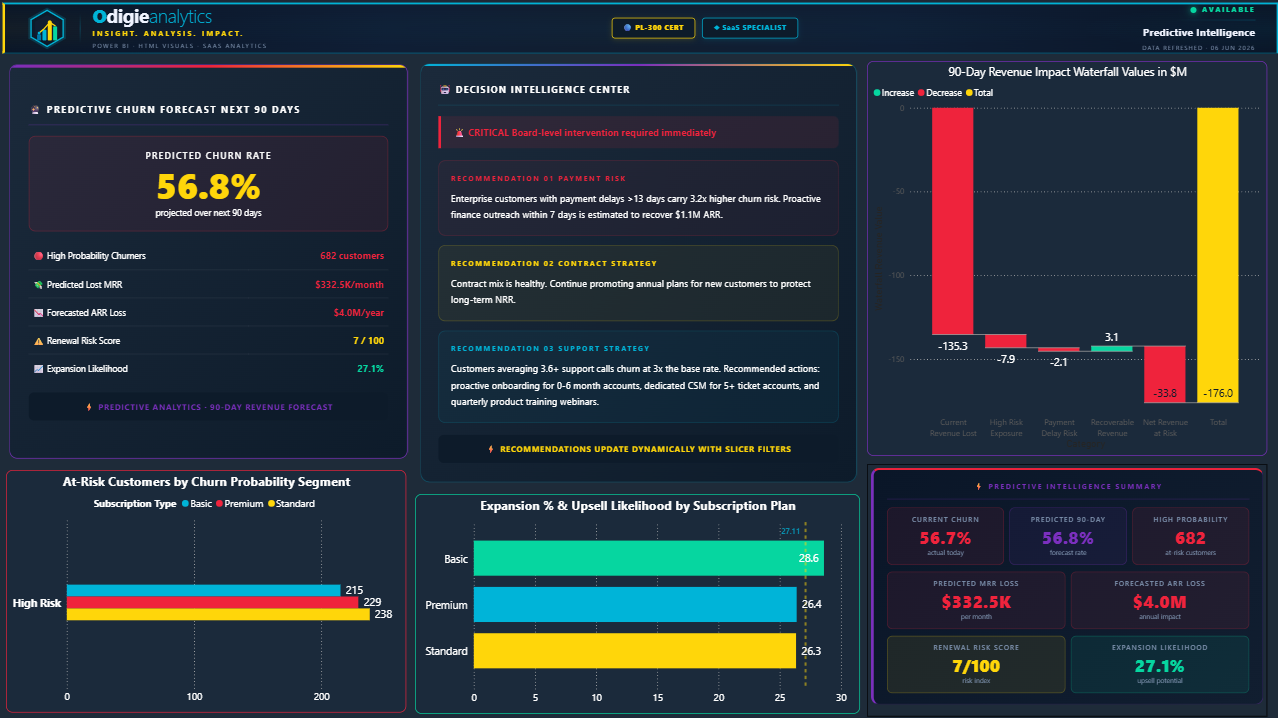
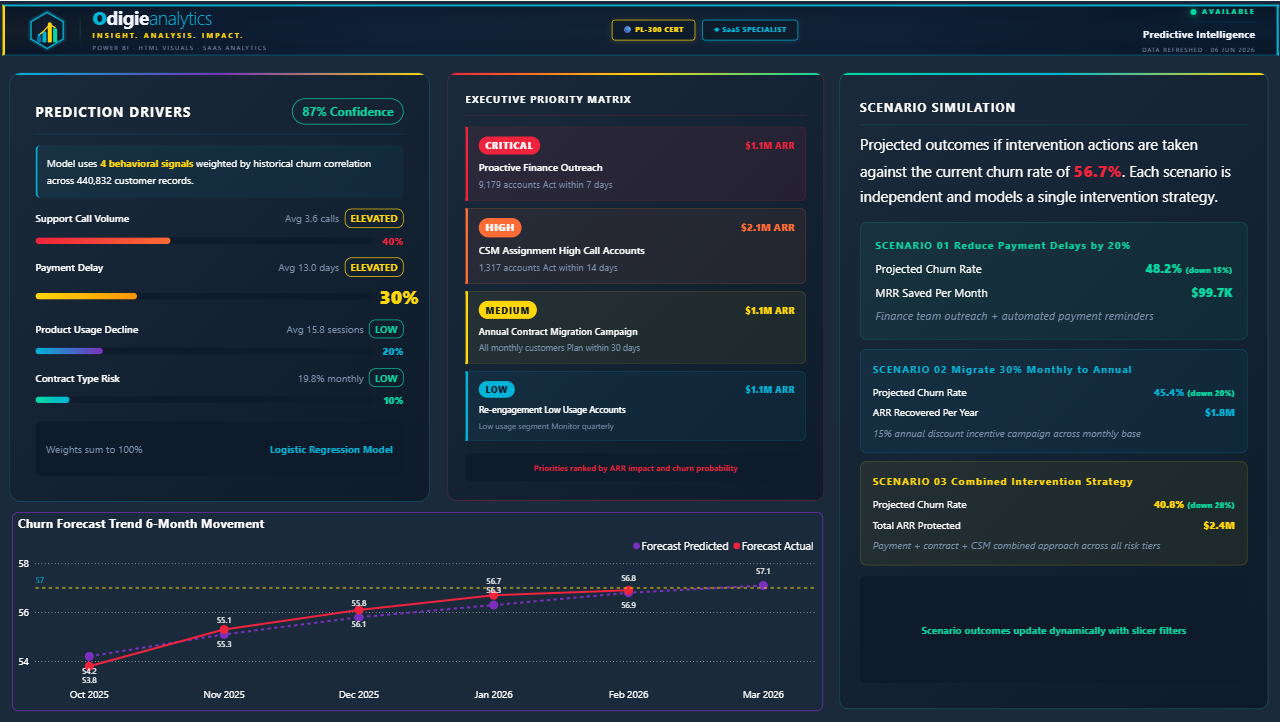
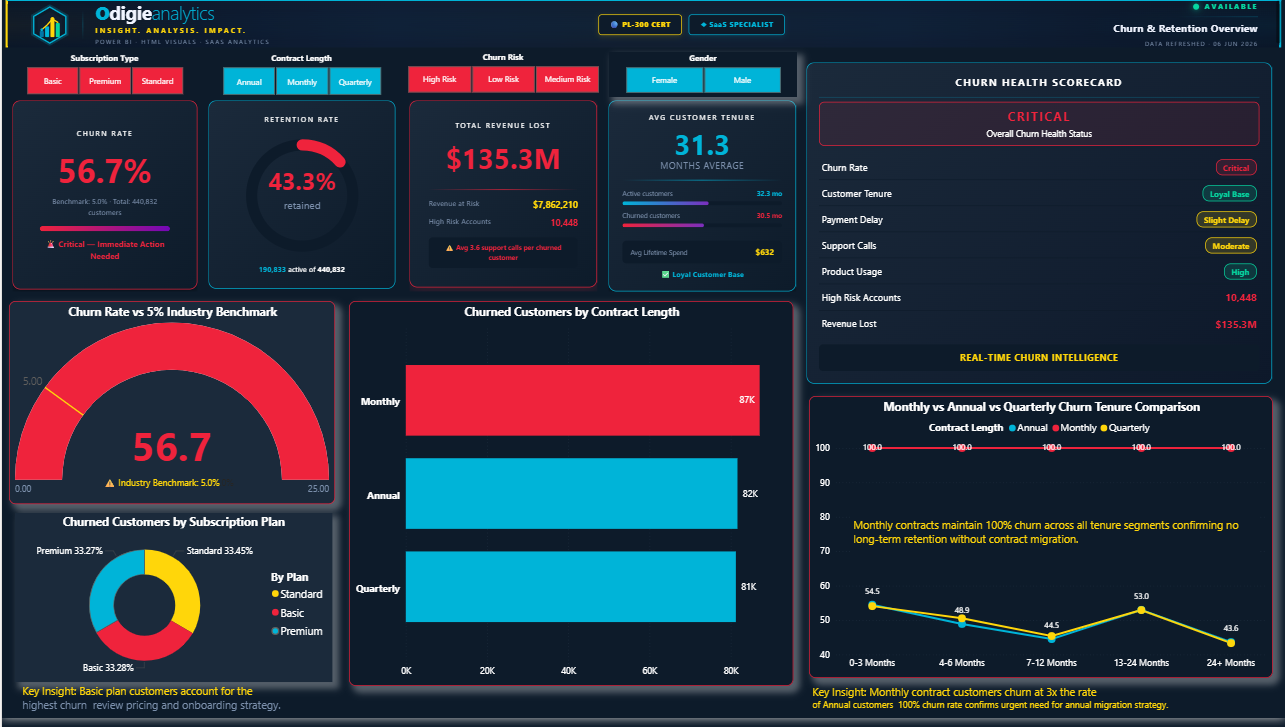
A SaaS company with 440,832 customers had no visibility into churn until accounts were already gone. Churn had climbed to 56.7%, more than 11× the 5% industry benchmark, but leadership had no way to see which accounts were at risk, what was driving exits, or how to prioritize retention spend.
Built a four-page Churn & Retention Intelligence Platform powered by a logistic regression model with 87% prediction confidence. The system surfaces at-risk accounts, root-cause churn drivers, and scenario simulations, so the team acts before revenue walks out the door, not after.
Leadership could identify at-risk accounts and act on retention before revenue was lost. The team moved from reactive to proactive in a single dashboard. Churn visibility went from zero to real time, with $143.2M in recoverable revenue surfaced on day one.
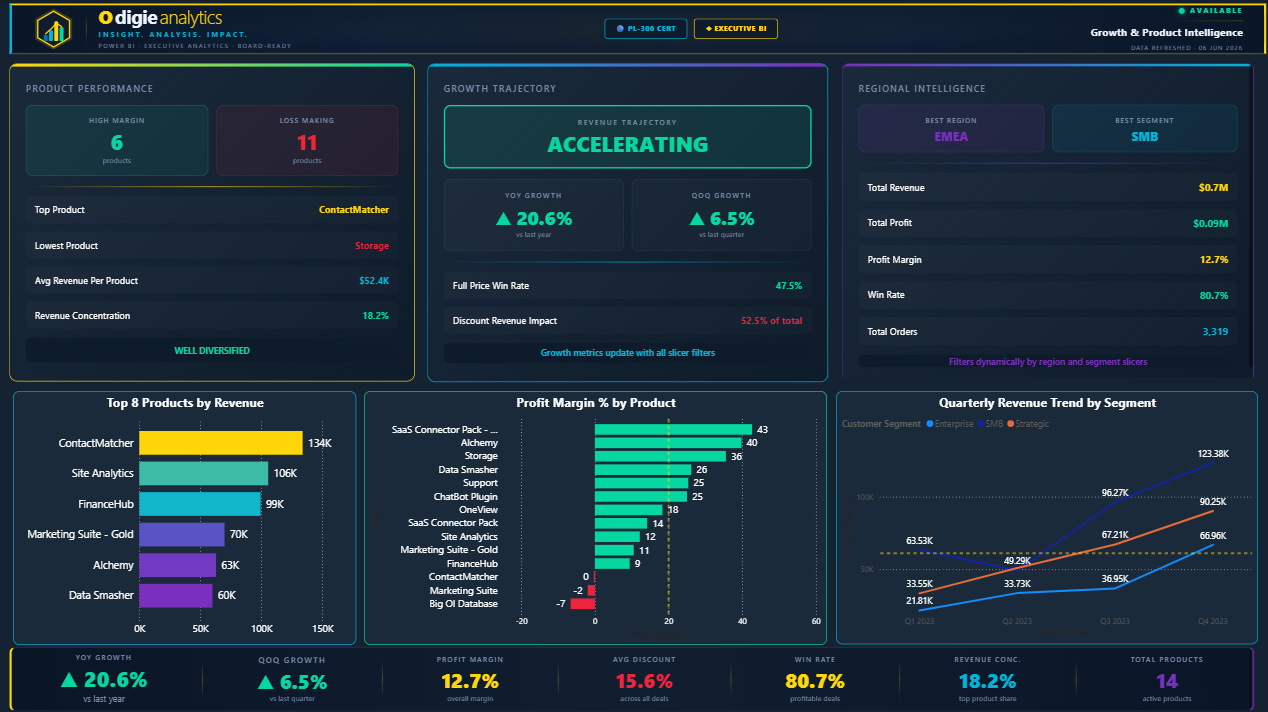
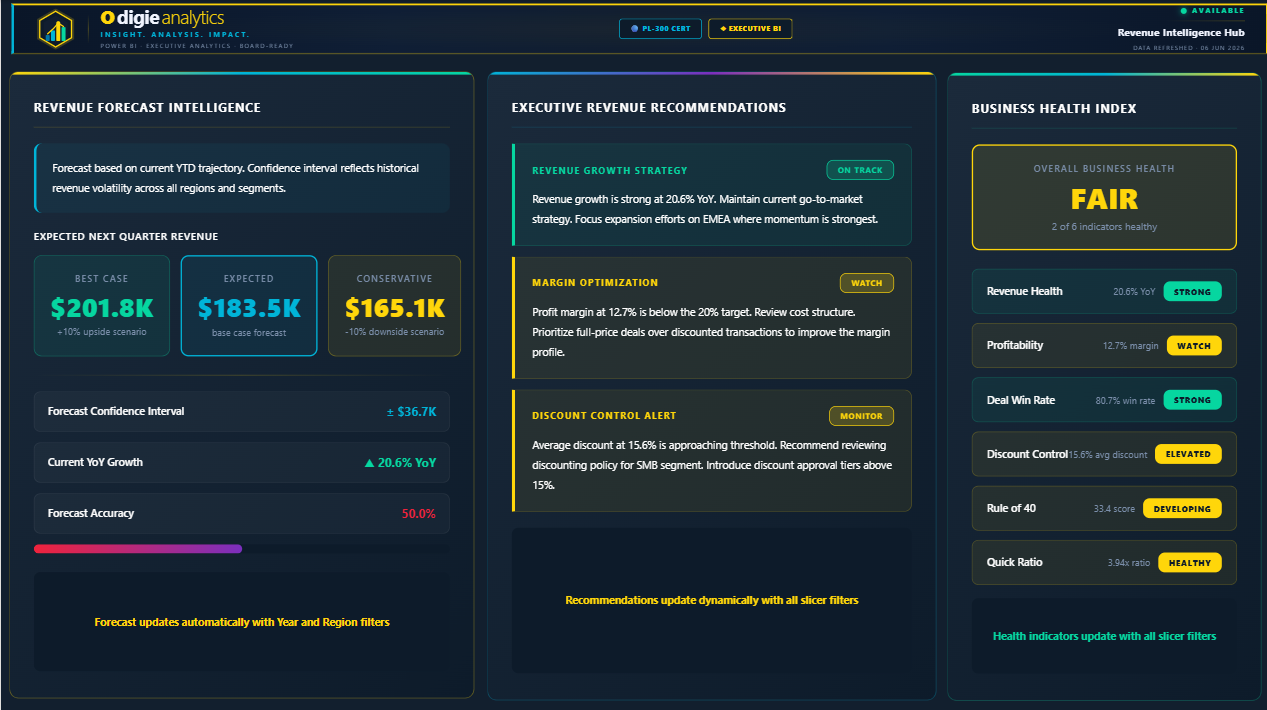
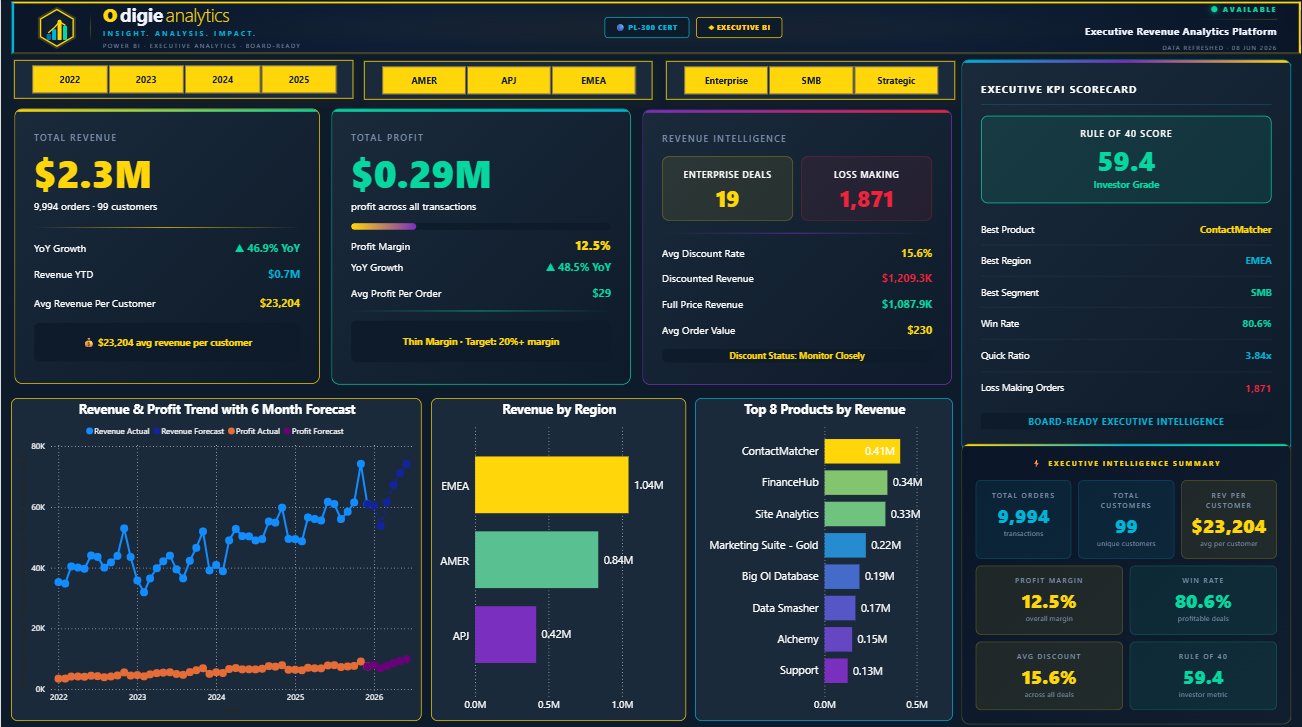
A B2B software company with 99 customers and 9,994 transactions had fragmented revenue visibility across three regions (AMER, EMEA, APJ) and three segments (Enterprise, SMB, Strategic). Finance and sales operated off different numbers with no unified view of growth trajectory, margin health, or which products were actually driving profitability.
Built a three-page Executive Revenue Intelligence Suite, a board-ready analytics system covering the full revenue story: KPI Scorecard with Rule of 40 tracking, Growth & Product Intelligence, and a Revenue Intelligence Hub with 6-month forecasting and a Business Health Index. Every metric filters dynamically by year, region, and segment.
Finance and sales aligned on the same numbers for the first time. Leadership could review full revenue performance across all regions, products, and segments in minutes instead of manually combining spreadsheets. 11 loss-making products were flagged immediately, triggering a pricing review.
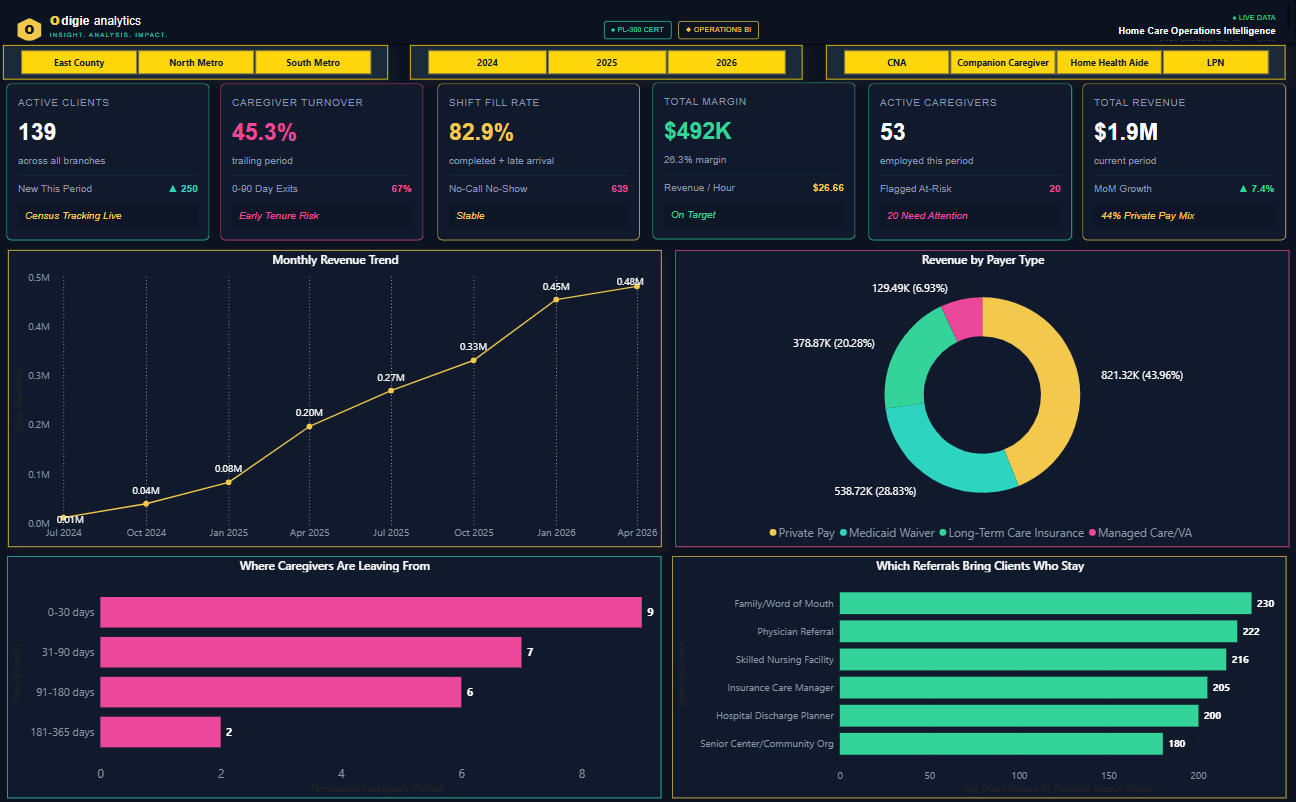
A multi-branch home care agency was flying blind. They had data scattered across scheduling systems, HR records, and billing platforms with no unified view of caregiver turnover, client retention, revenue by payer, or which referral channels actually delivered long-term clients.
Built a Home Care Operations Intelligence platform that consolidates workforce, clinical, and financial data into one real-time hub. Operators can now see caregiver risk, shift fill rates, margin by payer type, and referral quality, all in a single dashboard, live across all branches.
Branch managers could see caregiver risk, shift fill rates, and revenue by payer in one view. Decisions that previously took hours of manual reporting now happened in real time. At-risk caregivers were flagged before they left, reducing early-tenure turnover cost.
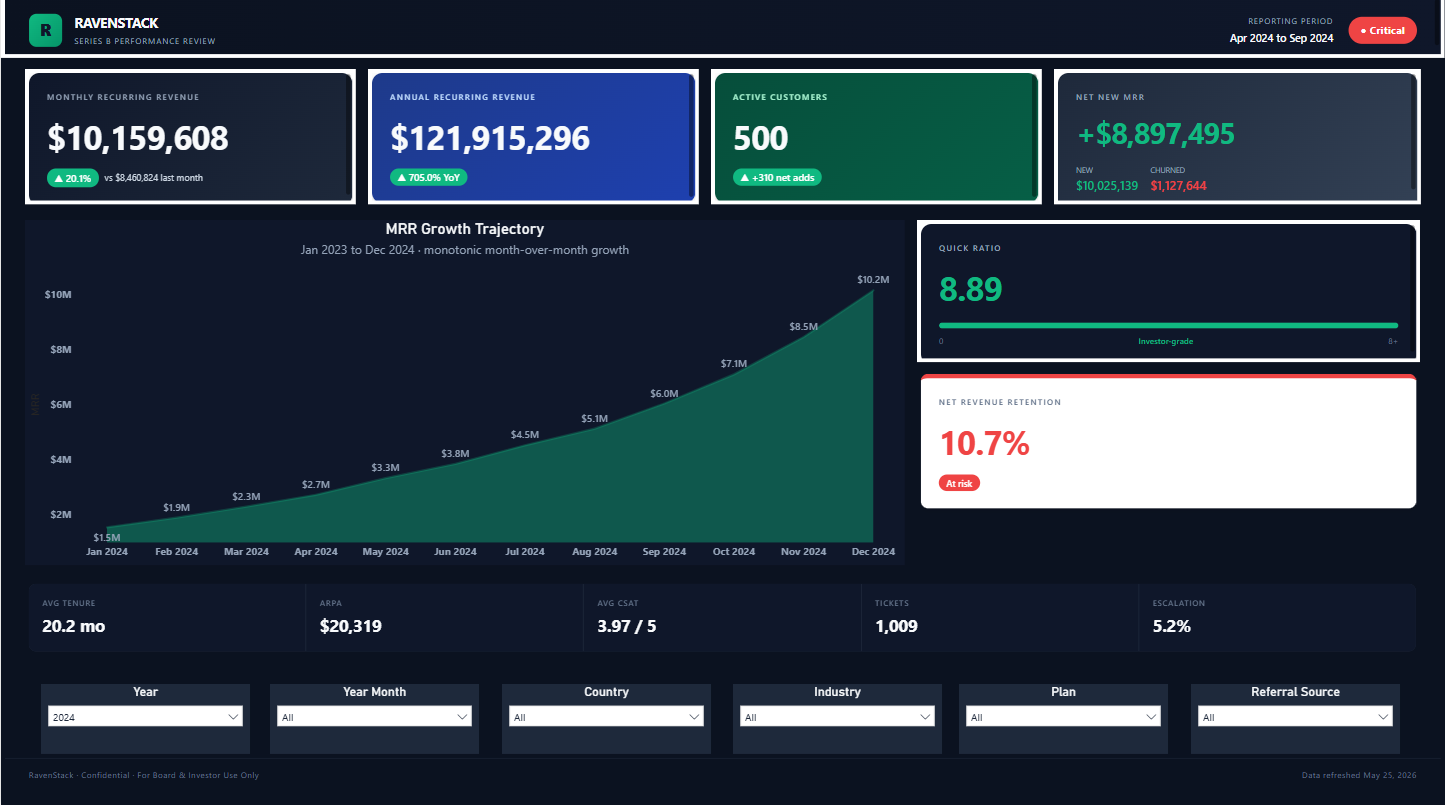
RavenStack, a high-growth SaaS company, needed a board-ready performance dashboard ahead of their Series B raise. Leadership had the raw data but no single view that told the investor story: MRR trajectory, growth velocity, churn health, and the investor-grade metrics (Quick Ratio, NRR) that sophisticated VCs demand in a data room.
Built a Series B Investor Performance Dashboard transforming raw transaction data into a compelling, board-ready intelligence system: monotonic MRR growth from $1.5M to $10.2M in 12 months, investor-grade ratios, and customer health metrics with dynamic filtering across year, country, industry, plan, and referral source.
Leadership walked into investor meetings with a board-ready dashboard that told the full growth story in one view, without spending days preparing slides or pulling data from multiple sources. The Quick Ratio of 8.89 became a headline talking point for VC due diligence.
Most reporting tools stop at showing numbers. I build dashboards that show your sales, expenses, profit, customers, and operations in one place. You always know what's working and what needs attention.
I've built analytics systems across finance, healthcare, home care, and SaaS. I don't need a crash course in your industry.
Certified Power BI Data Analyst and DAX Specialist. I know what's happening under the hood.
Every project includes a structured revision round. If the agreed scope is not met, I will make it right.
Everything I build is yours at delivery. Dashboards, models, DAX code. No licenses tied to me, no lock-in, ever.
You'll see a working draft within 5 business days of kickoff. Final delivery follows after your review.
The dashboard tells your team what to do next, not just what happened last month.
I review your data sources, KPIs, and business questions. No pitch, just clarity on whether and how I can help.
I connect your data sources (SQL, APIs, CSVs, or spreadsheets) and build a clean, fast data model underneath.
I design the dashboard, write the measures, build custom visuals, and apply your brand. Draft ready by Day 3.
Live walkthrough of every visual and metric, plus one full revision round to match your exact needs.
Published to your workspace with a recorded training video. Your team is self-sufficient from Day 1.
"Your data stays yours. I only request the access needed to build your dashboard, and whenever possible, I work through read-only exports, secure files, or your own Power BI workspace. I do not sell, reuse, or share client data. NDA available upon request."
Best for: Small businesses that need one clean executive dashboard from spreadsheets or simple data sources.
Best for: Growing businesses that need multiple dashboards, automated refresh, and deeper revenue or operations insights.
Best for: Businesses with multiple systems, complex reporting needs, or ongoing analytics support.
For businesses that want their dashboards maintained and updated as things change, without the cost of a full-time analyst.
Every package includes custom HTML visuals, a clean data model, documented DAX measures, one revision round, and publishing to your own Power BI workspace.
I'm Lawrence Odigie, a Business Intelligence Consultant with 14+ years turning raw data into the metrics that drive decisions across finance, healthcare, home care, retail, and fintech.
I work with businesses of all sizes who know they're sitting on useful data but haven't been able to get much out of it. You work directly with me. No outsourcing, no handoff, no junior analyst. I keep my client list small so every project gets my full attention.
My background is in operations and finance, which means I build for the way a business actually runs, not how it looks in a demo. Every metric I include has a reason to be there.
Tell me about your business and what you're trying to figure out. I reply within one business day.
Whether you're starting from a pile of spreadsheets or migrating off an old BI tool, I'll build something your team will open every morning.
I work with businesses across healthcare, home care, finance, retail, e-commerce, SaaS, logistics, real estate, and more. If your business runs on data and you need clearer visibility into it, I can help. The methodology adapts to your industry and your specific KPIs.
Not necessarily. If you don't have it, Power BI Pro is about $14 per user per month, or it's included in Microsoft 365 E5. I'll confirm exactly what you need on the discovery call. If your team already has Microsoft 365, you may already be covered.
Almost anything. I connect SQL databases, Excel spreadsheets, CSV exports, cloud platforms (Azure, AWS), CRMs like Salesforce and HubSpot, payment processors like Stripe, and industry-specific systems. If your data exists somewhere, I can likely pull it in.
Every project includes one full revision round. If after revisions you're still not satisfied, I'll refund the project in full. No questions asked. I take on a small number of clients per month precisely so this never happens.
You'll see a working draft within 3 days of project kickoff. Final delivery is 5 days for Starter, 7 days for Pro, and scoped individually for Enterprise projects.
Yes. I work with businesses globally. Most collaboration happens asynchronously via Loom, email, and shared documents. The discovery call and final walkthrough are live; everything else fits your time zone.
I use read-only access to your data wherever possible. I never download or store your raw data permanently. All work is done inside your own Power BI workspace, which you control. I am happy to sign an NDA before any data is shared.
No passwords needed. I connect to your data using secure, read-only credentials or exported files. You stay in control of your systems throughout the entire project.
Yes. I sign NDAs before any sensitive data or business information is shared. Just let me know on the discovery call and I will send one over before we start.
Yes. Your dashboard is published directly to your Power BI workspace. You own it completely. There are no subscriptions tied to me, no data stored on my systems, and no lock-in of any kind.
You receive a recorded walkthrough video so your team can get up to speed immediately. You own everything outright. If you want ongoing updates, maintenance, or new report pages, my Intelligence Retainer covers that.
It depends on your project, but typically I need exported reports, spreadsheets, or read-only access to your data source. We cover this in the 15-minute discovery call so you know exactly what to prepare before we start.
No. I never ask for passwords over email. Where system access is needed, we set it up securely through your admin panel with read-only permissions. In most cases, simple file exports are enough to get started.
Yes, and this is often how we start. Excel and CSV files are a perfectly valid data source for Power BI. Once the dashboard is built and working, we can connect it to live data sources if needed.
Yes. I sign NDAs before any sensitive data or business information is shared. Just mention it on the discovery call and I will send one over before we begin.
100%. Everything I build is yours. The dashboard, the data model, and all DAX measures are delivered to your own Power BI workspace. No ongoing fees tied to me, no lock-in of any kind.
Most data I work with needs some cleaning. Data preparation is part of the process. I will let you know during the discovery call if there is significant cleanup needed and factor it into the timeline and scope.
After the revision round is complete, the dashboard is finalized and published to your workspace. If you need further changes down the line, my Intelligence Retainer covers ongoing updates, new pages, and monthly maintenance.
Yes. Every project includes a recorded walkthrough video so you and your team know exactly how to use the dashboard, what each metric means, and how to apply filters. Written measure documentation is available on request.
Yes. The final delivery includes a live walkthrough call where I walk through every page and metric with you. I also record the session so your team can reference it anytime. Additional training sessions can be added for larger teams.
Yes. My Intelligence Retainer ($1,200/month) covers ongoing maintenance, monthly KPI updates, new report pages on request, data refresh monitoring, and one strategy call per month. It is designed so you never have to manage the dashboard alone.
Check the portfolio section above. I have built dashboards for SaaS, healthcare, home care, finance, and B2B companies. If you do not see your exact industry, reach out and I will share relevant examples from similar sectors.
Book a free 15-minute call. We'll talk through your data, what you need, and whether I'm the right fit.